Case 1 SPSK model
In this case a single porosity single permeability model will be considered. This example assumes that the user has completed the ParaGeo geometry generation step.
The simulation considers the following stages:
1.Geostatic initialization with application of the gravity load
2.Displacement reinitialization
3.Production simulation
Basic Set Up: Data file description
The initial data file for the project is: IX_002\Case1\Data\IX_002_Case1.dat. The basic data includes: 1Geometry_data to read the previously generated .geo file 2Units data used to convert values to the reservoir simulator units. 3Geometry_set data defining the boundaries and the different sediment volumes of the model. Note that this data is already stored in the .geo file and therefore it is not required. 4Stratigraphy data (Stratigraphy_definition and Stratigraphy_horizon data structures) to identify the top surface of the model. 5Group_data for two groups (reservoir and shale) and Group_control_data to define geomechanical field active for both groups. 6A Material_data and Fluid_properties data structures defining the reservoir and shale material properties. 7Support_data defining the displacement and pore pressure constrains. 8Geostatic_data for geostatic initialization including Spatial_variation_definition and Spatial_variation_values data to initialize porosity in shale. 9Gravity_data with its corresponding Time_curve to apply the gravity load. 10Loading data (Global_loads and Load_case_control_data) to define a temperature load varying with depth (using also Spatial_variation_definition and Spatial_variation_values). 11History_point data structures to output variable history during the simulation. 12Reservoir_coupling_data to define the coupling options between ParaGeo and IX. 13Time_scaling_data defining a target optimal time step of 2.0E-5 days. 14Damping_global_data defining bulk viscosity damping. 15Geostatic_control_data for the two initialization stages defining the initialization conditions: a.Standard initialization by application of the gravity load during first stage b.Reinitialization of displacements during second stage. 16Control data (Control_data) for the two initialization stages defining: (a) Incremental solution algorithm (Type 1), (b) Maximum number of time steps of 1E5. (c) Duration time of t=0.5 (so model will be fully initialized at time 1). (d) Factor of critical time step = 0.7, (e) Plot file output every 0.1 days, (f) Plot file output at the end of the stage, (g) Screen message output every 1000 mech steps, (h)Output of a restart file at the end of each initialization stage.
After initialization additional data is defined during the third stage (simulation run): 17Additional History_point data defining history output at every coupling step for the injector (I), observer (OBS) and producer (P) point locations. 18History_section_line data to output history data every 10 coupling steps on a defined well path. 19Reservoir_control_data defining: (a) The target number of ParaGeo mechanical steps per each IX flow steps (set to 200) (b) The minimum mechanical step size set to 1E-8 below which the simulation would terminate prematurely (e.g. because of convergence issues) (c) Echo to the screen at every step (d) Plot output at the end of the simulation (e) Plot output at specified dates
|
Results
The result files for the project are in directory: IX_002\SPSK_1\Results
A production stage followed by a shut down has been simulated using coupling between ParaGeo and IX. The history results at the injector, observation and producer points are output to the file IX_002_SPSK2_002.hdh, can be pasted to the IX_002_Results.xlsx spreadsheet and are discussed below.
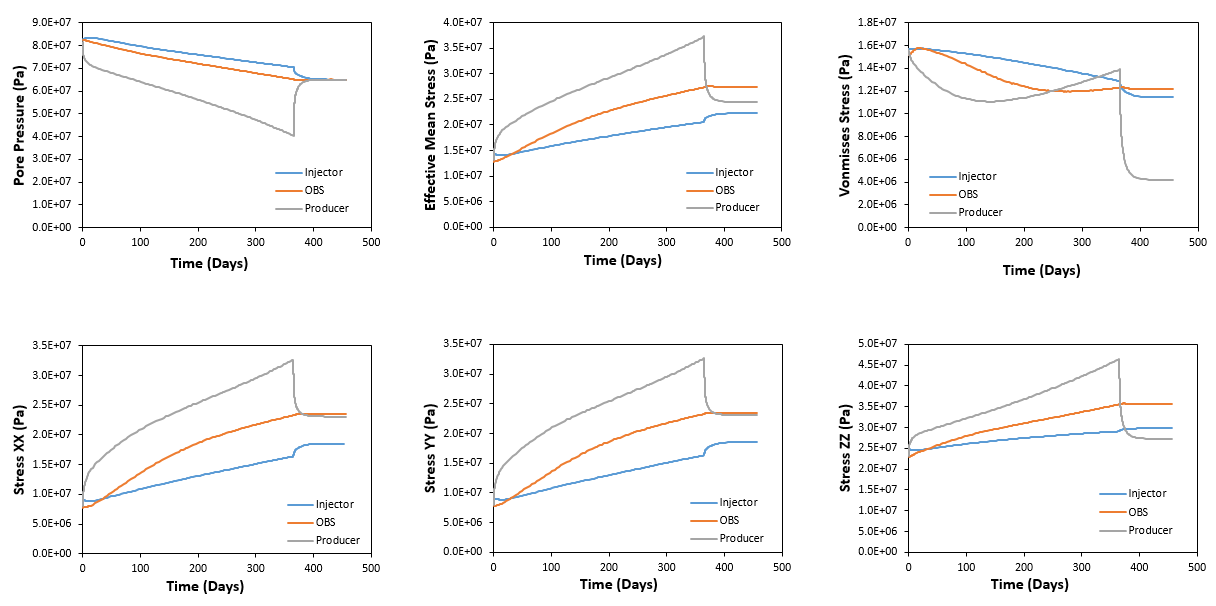
The evolution of pore pressure and stresses with time is shown below. It can be seen that:
1.As expected pore pressure in the injector is higher than at the observation which at the same time is higher than that at the producer point. It can be seen that initially at the injector there is a pore pressure increase to stimulate production but it is gradually decreased as the pressure at production point decreases. After shut down pore pressure within the reservoir equilibrates so that pore pressure at the three points is the same.
2.As pore pressure decreases due to production the effective mean stresses in X, Y and Z directions increase (and hence the effective mean stress too). After shut sown the behaviour is different in the three points: a.Stresses increase at the injector point as increase of pore pressure to stimulate production has ceased (so there is a pore pressure decrease as shown in the plot). b.Stresses decrease substantially at the producer location because after shut down there is flow from the reservoir formation to near producer wellbore location equilibrating pore pressure. Hence there is a local pore pressure increase (as shown in the pore pressure evolution figure) leading to a decrease in stresses due to unloading. c.The observation point is in between the producer and the injector and there is no important drop nor increase in pore pressure after shut down and therefore no subtaintial change in effective stresses.
3.After shut down the effective stresses in X, Y and Z directions (and also the effective mean stress) for the producer well fall down below the observation point (for the case of the vertical effective stress it falls even below the value for the injector). This is an indicative of stress arching (see the contour plot below).
4.The deviatoric stress (Von Misses stress) shows a different behaviour at the three points: a.At producer location there is an initial drop in deviatoric stress which starts to increase after c.a. 150 days of production. Following the production shut down there is a drastic drop in the deviatoric stress. b.At observation point location the effect is similar but there is less change and the increase in deviatoric stress is delayed relative to the producer point. Note that an initial increase in deviatoric stress is clearly visible at the observation point which also occurred at the producer location but is not visible due to the time resolution (the increase occurred more rapidly). c.At injector location the deviatoric stress continuously decreases during production stage. At shut down there is a more rapid deviatoric stress decrease. d.Note that the evolution of deviatoric stress depends on the evolution of the three principal stresses. Analysis of the stress path in the p' - q space discussed below will provide better understanding.
Evolution of pore pressure and stresses for the injector, observation and producer points
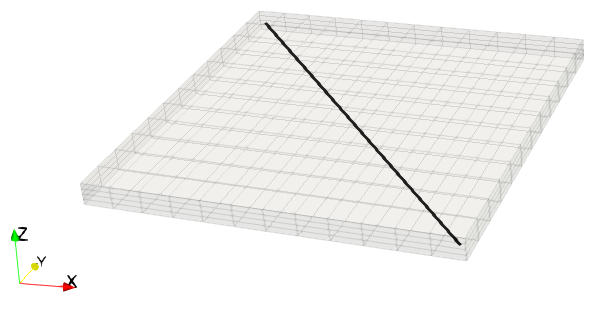
Contours of vertical effective stress (left) and vertical effective stress along a line (right) in the reservoir at the end of the simulation
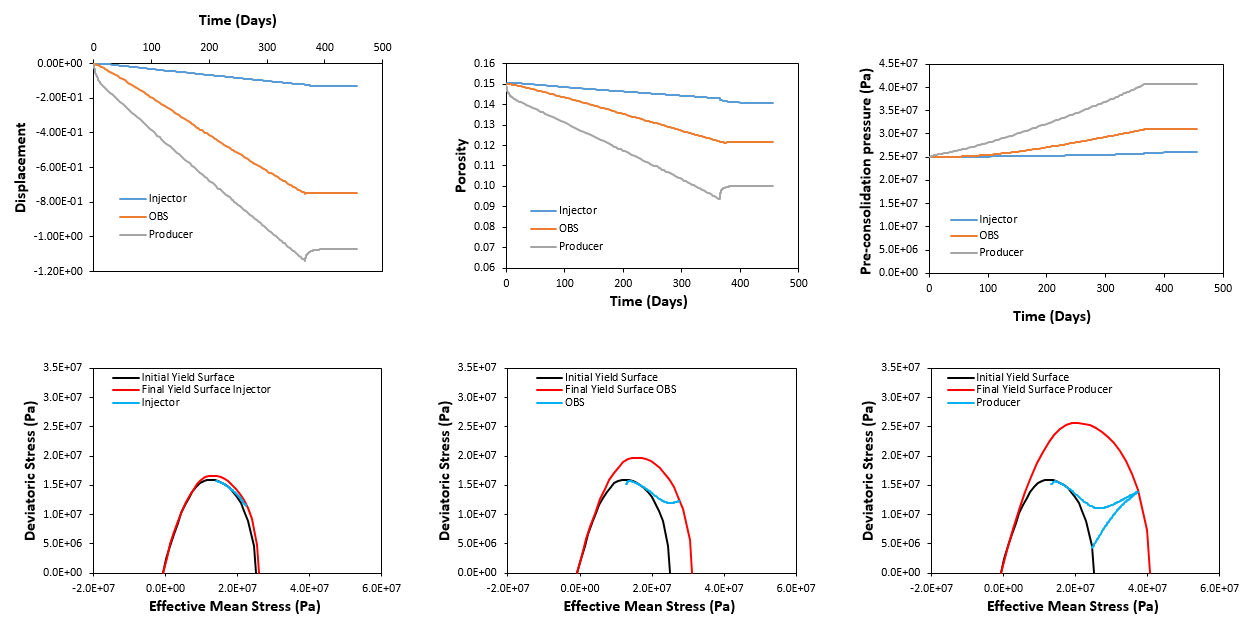
In the figure below evolution of displacement, porosity, pre-consolidation pressure and stress paths for the three control points is provided. In can be seen that:
1.Displacement and porosity plots show that during production there is subsidence due to compaction as pore pressure decreases and effective stresses increase. After shut down at the producer well location there is an elastic porosity increase due to elastic unloading (due to re-equilibration of pore pressure) whereas at injector location there is additional porosity loss due to the stop of injection (further pore pressure decrease).
2.Subsidence and porosity reduction has larger magnitude as we move from the injector towards the producer locations.
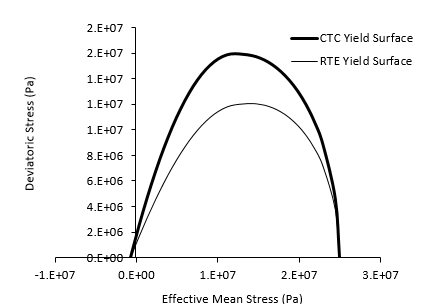
3.Pre-consolidation pressure has increased during production stage for all the wells due to plastic deformation (compaction). Note that pre-consolidation pressure is an indicator of the strength of the material so that as pre-consolidation pressure increases, the yield surface size increases (and hence the material strength).
4.The stress path plots show that the yield surface has increased in all three locations (as seen in the pre-consolidation pressure evolution) with the largest strength increase occurring at producer location. The plots show that: a.At the producer and observation locations the stress state was initially inside the yield surface and when production started there is a short initial elastic path in which both effective mean stress and deviatoric stress increase (this is consistent with the initial small deviatoric stress increase mentioned above for those two points). b.The stress path at the producer location shows that initially there is an effective mean stress increase with a deviatoric stress decrease until a minimum deviatoric stress is reached. This is because as production progresses the drop in pore pressure (and consequent effective stress increase) leads to consolidation driven by the overburden weight. Hence the deformation conditions are mostly uniaxial and the stress path reflects that by moving towards the k0 line. Further compaction during production leads to both effective mean stress and deviatoric stress increase following the k0 line. After shut down there is elastic unloading and both the effective mean stress and deviatoric stress decrease with the stress path moving inside the yield surface. Note that the fact that the final stress state lies above the initial yield surface it is just a coincidence and has no physical meaning. c.The stress paths at the observation and injector locations behave similar to the initial stress path at producer location with the stress path moving towards the k0 line as production and consolidation progresses.
Evolution of displacement, porosity and pre-consolidation pressure (top) and stress paths (bottom) for the injector, observation and producer points
From the ParaGeo geomechanical calculations multipliers for IX compressibility, pore volume and permeability are derived so that such properties can be updated in IX. A multiplier value of 1.0 for a given property signifies that there is no change in such property. The figures below show the evolution of the multipliers derived from ParaGeo. Note that the figures show the cumulative multipliers (relative to the respective initial property values). It can be seen that:
1. The compressibility multipliers show an increasing trend during production phase for the producer and observation wells whereas the injector shows a decreasing trend. Note that the definition of compressibility adopted includes weighting for porosity.
2.As expected the evolution of the cumulative pore volume multiplier is consistent with porosity evolution (note that porosity is the percentage of pore volume for a unity volume).
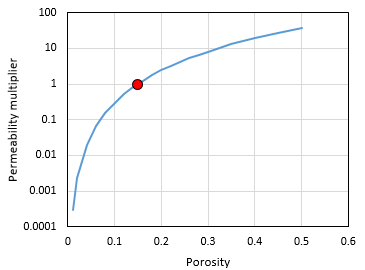
3.Because permeability is a function of porosity the behaviour of the permeability multiplier should show a positive correlation with the pore volume multiplier. This is observed in the figures.
4. The plastic compaction concurring during production has led to a reduction in both pore volume and permeability at all three point locations. The larger change as expected occurred at producer location where at the end of simulation the pore volume has decreased to 66.8 % of the initial pore volume and permeability has decreased to 29.6 % of the initial permeability.
Evolution of pore volume multiplier, cumulative pore volume multiplier and permeability multiplier for the injector, observation and producer points
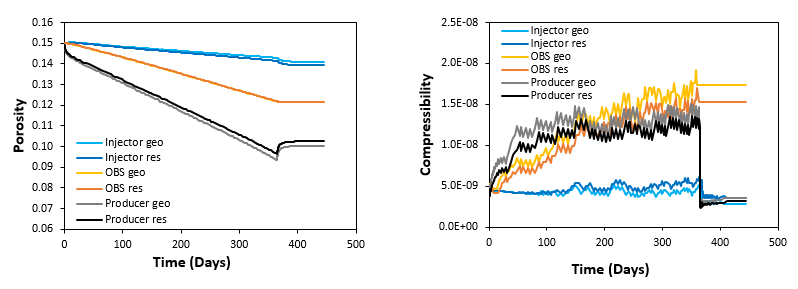
It should be noted that in IX the initial value of compressibility is specified whereas in ParaGeo it is calculated from Young modulus, porosity and Poisson's ratio (for the case of elastic compressibility). Hence it is very important to make sure that the initial compressibility in IX is consistent with the initial compressibility as calculated from initial ParaGeo properties after initialization stage. Below is shown a plot comparing porosities and compressibilities at the three point locations for IX and ParaGeo. As can be seen there is some divergence on the porosity and compressibility values between the two codes. This may happen if a multiplier approach update of compressibility and porosity values in IX is adopted (as done in the present case). Note that there is an alternative method of using absolute values calculated from ParaGeo to update IX values by which results for both codes should be consistent.
Comparison of the evolution of porosity and compressibility between ParaGeo values (geo) and IX values (res) for the injector, observation and producer points
|
References
Dean, R.H., Gai,X., Stone, C.M. and Minkoff, S.E. (2006). A comparison of techniques for coupling porous flow and geomechanics. SPE Journal, 11(1), 132–140.
|


