Case01 Constant contact properties for fluid and thermal contact
Basic Set Up: Data File Description
The initial data file for the project is: Cont_002\Case01\Data\Cont_002_Case01a.dat. The basic data includes:
1Geometry_set data for all model boundaries and the two fault surfaces. 2Contact data (Contact_set, Contact_property and Contact_global) for defining contact between fault hanging wall and foot wall. 3A single Group_data with 2D triangular elements and Group_control_data defining the group active for geomechanical, fluid flow and thermal fields. 4Material_data and Fluid_properties defining elastic properties, constant isotropic permeability and constant isotropic thermal conductivity. 5Support_data to defining: (a) Displacements constraints in the normal direction to bottom and side boundaries (b) Pore pressure constraints in the top and bottom model boundaries. (c) Temperature constraint at the top boundary. 6Geostatic_data to define an initial state with 0 MPa pore pressure. 7Load data defining: (a) A stress load at the top surface of 10 MPa (b) Pore pressure of 10 MPa at the bottom boundary (c) Thermal flux of 1.51·1012 J· m-2 · Ma-1 at the base (equivalent to 48 mW · m-2). 8Mesh control (Mesh_control) and Unstructured mesh generation data (Unstructured_mesh_data) defining a constant mesh size of 100 m. 9Damping data (Damping_global_data) defining velocity damping of 2%. 10Couple_control_data defining: (a) Coupling for geomechanical, fluid flow and thermal fields (b) Incremental solution algorithm (c) No volume strain coupling (neglect increase of pore pressure due to compaction). 11Control data (Control_data) for two stages defining: (a) Incremental transient solution algorithm (Type 4), (b) Maximum number of time steps of 108 (very large) (c) Target number of mechanical steps per flow step of 200 (d) Termination time for each stage (1 Ma and 11 Ma respectively), (e) Coupling step of 0.01 Ma (Initial_time_increment) (f) Maximum number of iterations of 5000 (g) Factor of critical time step = 0.7, (h) Plot file output at the end of each stage, (i) Plot file output every 0.25 Ma, (j)Screen message output every 10 coupling steps, 12Geometry data (nodal_data, Geometry_line and Geometry_surface) for definition of the 2D geometry.
This tutorial example focuses on definition of the contact data for the flow and thermal fields. Hence a detailed description of data structures not relevant to the topic will not be provided. However a summary of the data relevant to perform a coupled simulation is provided.
|
| Results |
The results for the project are in: Cont_002\Case01\Results. In addition to the base case Cont_002_Case01a.dat additional data files and results are provided with variation on some contact parameters to show how they influence the results.
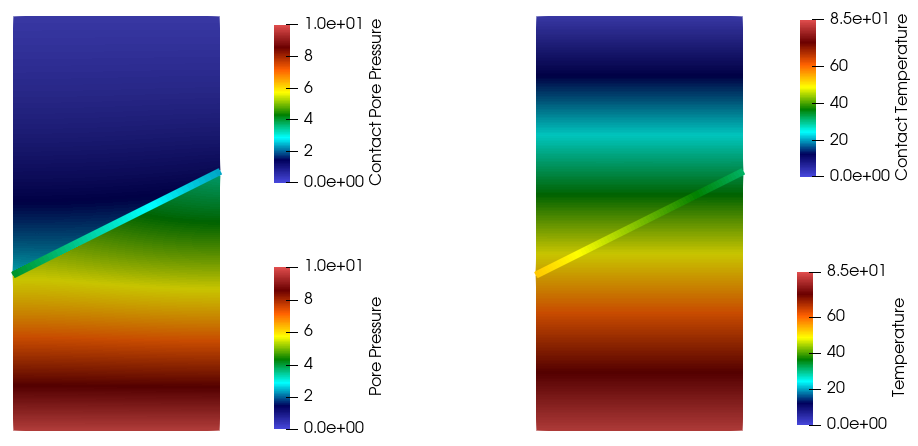
In the results below it can be seen that for the chosen conditions and properties some pore pressure has been transferred from the footwall to the hanging wall but provided the relatively low contact conductivity of the fault gouge the fault has behaved as a fluid flow barrier. In the plot on the right it can be seen that, as the contact thermal conductivity was input to be the same as the matrix grain thermal conductivity, the fault has no effect in the temperature distribution (so essentially horizontal contours without discontinuities / jumps are predicted).
Pore pressure and temperature distributed in the domain and fault.
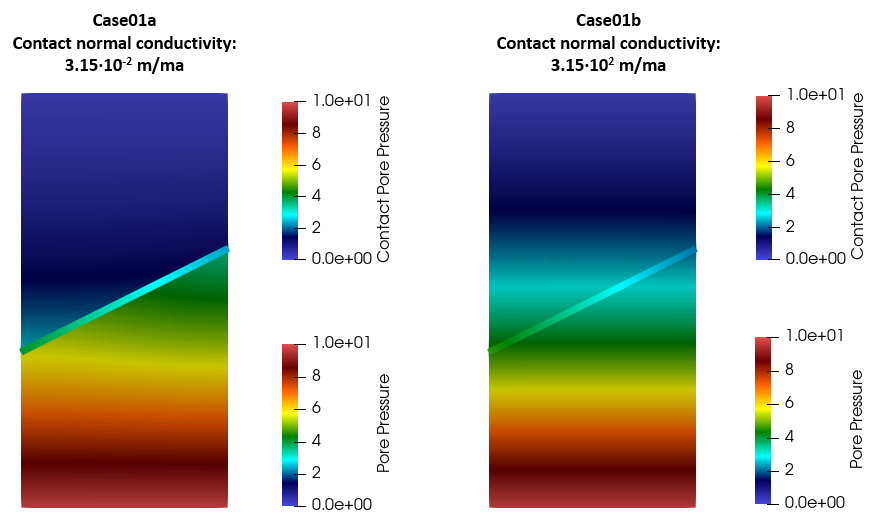
In Case01b the filter cake perm has been increased by a factor of 104 . Such permeability for a fracture of 1 mm width is high enough to ensure that the fault does not act as a barrier for the flow and horizontal pore pressure contours are predicted.
Demonstration of the effect of contact normal conductivity
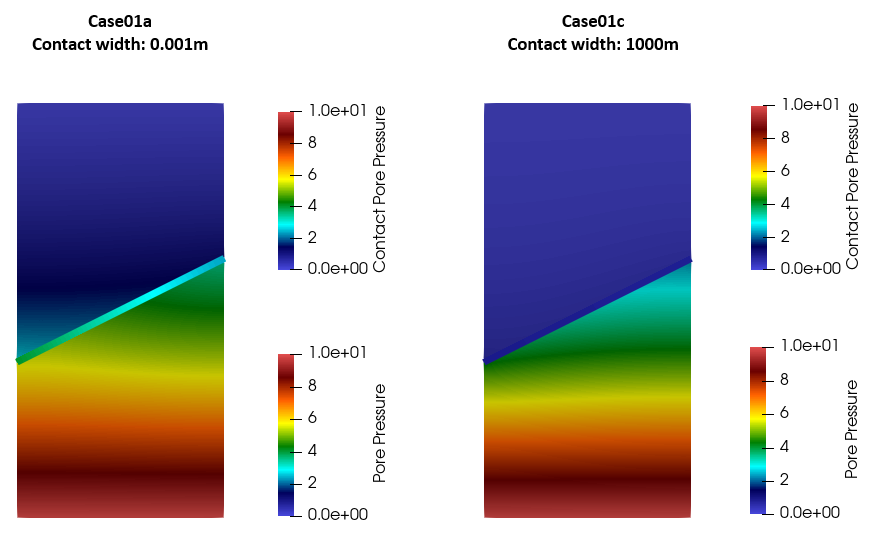
In Case01c the contact width is increased by a factor of 106 resulting in a contact width of 1000 m. It should be noted that such a value is unrealistic as no fault is expected to have 1 Km of fracture width. However it has been chosen for demonstration purposes to view the effect of contact width in the present conditions and properties. It can be seen that given the width is increased by a large amount, the storativity of the fault has also increased. Hence the fault can accommodate large amounts of fluid volume before experiencing any pore pressure increase. This resulted in no pore pressure transfer from the footwall to the hanging wall block.
Demonstration of the effect of contact width
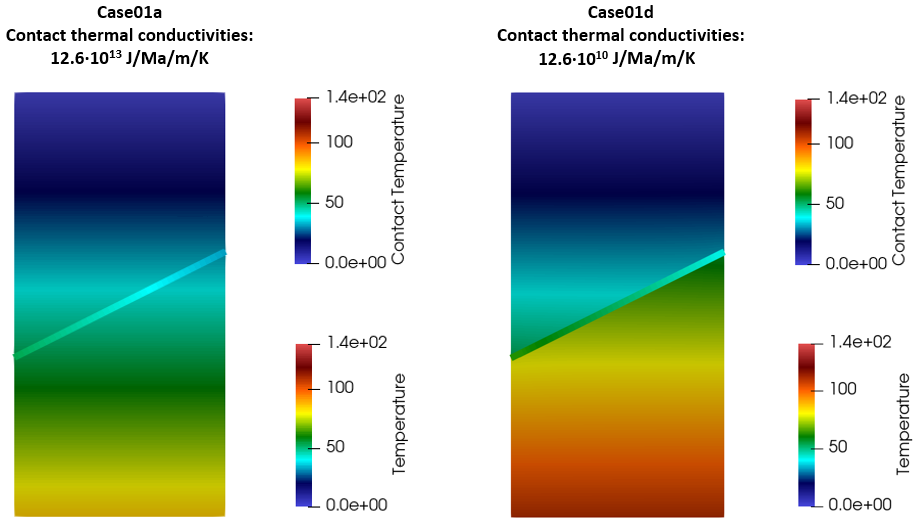
In Case01d the contact thermal conductivity (filter cake) has been decreased by a factor of 106. Hence the thermal conductivity of the fault is 106 lower than the conductivity of the matrix. Even for a 1mm fault this resulted in larger temperatures in the footwal than in Case01a, due to the larger resistance to transfer heat.
Demonstration of the effect of contact thermal conductivities
|


