Rest_003_FwdSim Forward model
With the isopach data output from the restoration described in the previous work flow step a forward model data file will be defined. Basically what needs to be defined is the initial salt geometry, boundary conditions, initialisation data, include data to include the isopachs .dat files and any additional data required.
Note that the isopachs are very thick (more than 1 Km thick) so it is convenient to subdivide the formations during depositions. This will be done automatically by using the sub-layer approach. This will allow to sub-divide the deposition of each formation to a specified number of sub-layers and merge them into a single formation (for an example see Sub-layer deposition).
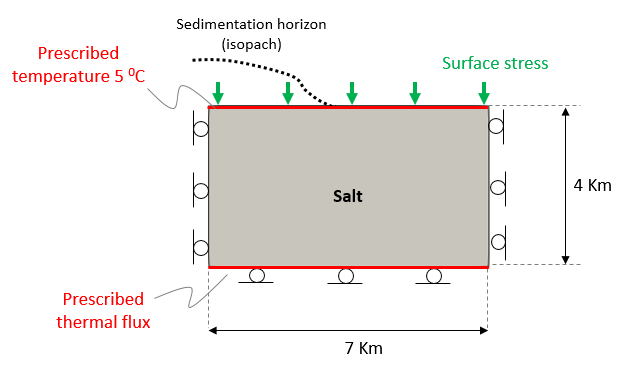
The starting salt geometry is 7 km long and 4 km high. The simulation will be run coupling geomechanical, fluid flow and thermal fields. Displacements are constrained in the normal direction for the base and side boundaries. The top surface is prescribed a stress load of 0.2 MPa, a pore pressure of 0 MPa and a temperature of 50C. The base is prescribed a thermal flux of 1.51·1012 J · m-2 · Ma-1 (48 mW · m-2).
Look for ! TODO text in the datafile and follow the instructions.

Initial model geometry and boundary conditions
Basic Set Up: Data File Description
The initial data file for the project is: Rest_003\02 Forward Model\Data\Rest_003_FwdSim.dat. Look for ! TODO text in the datafile and follow the instructions. The basic data includes:
1Geometry_set data defining the model boundaries 2Group_data for the Salt which is assigned the "Salt" properties and is defined no volume strain coupling in order to avoid generation of overpressure within the salt. 3Group_control_data defining all fields as active. 4Material_data for "Salt" and "Shale" pointing to the material file "2D_Minibasin.mat" 5Stratigraphy_definition and Stratigraphy_horizon identifying the top of the salt and the basal horizon. 6Stratigraphy_smoothing to ensure that there are not sharp angles in the top surface. 7Stratigraphy_surface_load and Stratigraphy_basal_load defining boundary constraints for the top surface and the base. 8Gravity_data and Geostatic_data with stress ratios defining an isotropic stress initialization. 9Support_data defining fixity in normal directions for base and side boundaries 10Mesh_control_data and Unstructured_mesh_data defining a constant element size between of 300 m. 11Couple_control_data defining: (a) Coupling of geomechanical, fluid flow and thermal fields. (b) Undrained split coupling scheme with a variable volume update algorithm (c) Incremental solution algorithm 12History_golbal data to monitor kinetic and elastic energies 13Damping_global_data to define bulk damping on the effective mean stress (Bulk Viscosity model) 14Control data (Control_data) for the initialisation stage defining: (a) Incremental transient solution algorithm (Type 4), (b) Duration of 1 Ma, (c) Coupling time step of 0.01 Ma (Initial_time_increment) (d) 100 Mechanical steps per coupling step (Target_number_time_steps) (e) Maximum number of time steps of 108 (very large to avoid premature termination) (f) Maximum number of iterations of 105 (very large to avoid premature termination) (g) Factor of critical time step = 0.9, (h) Plot file output every 0.5 Ma, (i) Plot file output at the end of the stage, (j) Screen message output every 10 coupling steps, (k) Output of a restart file at the end of the stage. 15Adaptivity_control_data and Adaptivity_set_data defining remesh with element size of 200 m for the Salt and 100 m for the sediments. 16Include data to include data generated during restoration for the isopach sedimentation stages 17Stratigraphy_pinchout_data for the last stage in order to prevent thin and slender sediment pinch-out at the flanks. 18Geometry data (nodal_data, Geometry_line and Geometry_surface) to define the initial geometry
|
Results
The result files for the project are in directory: Rest_003\02 Forward Model\Results.
The figure below shows the sublayer deposition and merging process used in the simulation. It can be seen how when Formation 1 sub-layer 3 starts to be deposited and its mesh is created, sub-layers 1 and 2 are merged into a single group. By using this sedimentation option the simulation accounted for 7 deposition steps which eventually resulted in 3 thick formations (3 ParaGeo groups) at present day.
Example of the sub-layer deposition and merging process
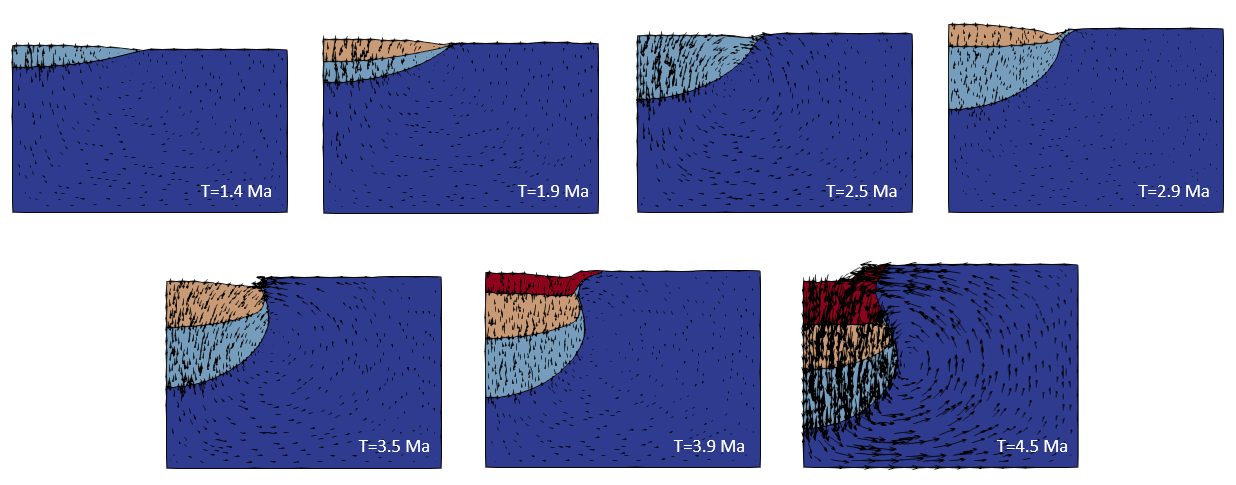
The figure below shows the evolutionary geometry and the velocity vectors. It can be seen that as layers are deposited the mini-basin sank into the salt leading to salt evacuation below the mini-basin and diapir rise at the mini-basin flank. It can be observed as well that the diapir head generates tectonic compression towards the sediments in the mini-basin flank (see the horizontal vectors at the top of the diapir).
Evolution of the model geometry through time with velocity vectors
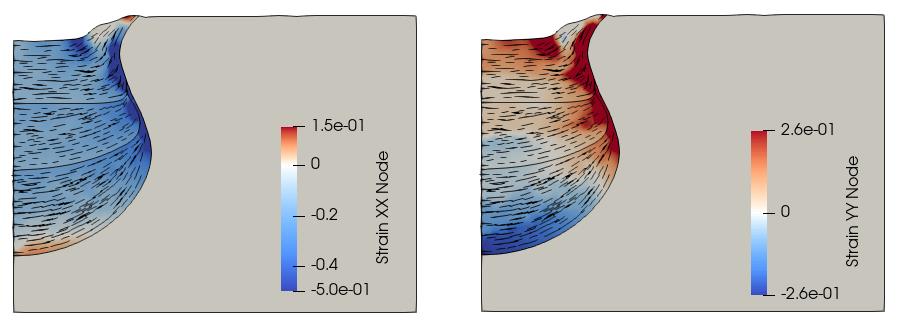
The following figures show strain in X and Y directions respectively (in the global coordinate system) with the local material system indicated by the black lines. As can be seen the sediments near the mini-basin flank experienced lateral tectonic compression and vertical stretch (note that the strain magnitudes in the color scale have been limited for the sake of facilitating understanding of the deformation regime).
Horizontal and vertical strain contour plots. The black lines indicate the local material system to show rotation in the mini basin flanks.
In the following figures the present-day predicted porosity, over-pressure and temperature distributions are illustrated. It can be seen that:
1.There is a general trend of porosity decrease with depth except in the mini-basin flanks where large porosities are predicted due to softening resulting from the heavy stretch illustrated in the previous figures (note that the maximum porosity magnitude has been limited to the depositional porosity).
2.The overpressure distribution shows a trend of increasing overpressure with depth near the depocentre but overpressure decreases towards the mini-basin flank. This is a result of the of the overturned mini-basin flanks and the rotated transverse isotropic permeability (permeability in the bedding plane direction is larger than the permeability normal to the bedding plane). Thus the overturned mini-basin flanks facilitated transfer of high pore pressures from deeper regions near the depocentre to shallower regions near the flank. Also the high porosity (and consequently high permeability) resulting from the high stretch near the flanks contributed to dissipate overpressure in that region.
3.Temperature distribution shows that the maximum temperature is found below the mini-basin centre as salt has higher thermal conductivity than the sediments.
Porosity , overpressure and temperature contours at present day
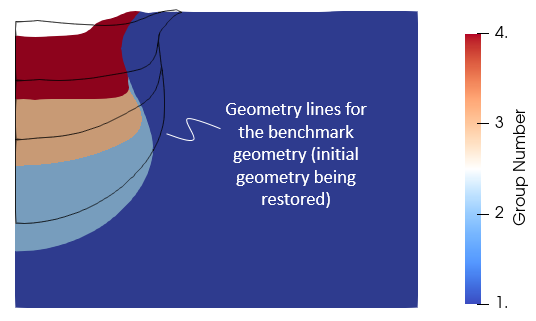
In the figure below the predicted geometry at present day configuration (t=4.5 Ma) is compared to the target benchmark geometry. As can be seen the predicted mini-basin shape differs considerably from the benchmark geometry. The present forward simulation predicted more sinking of the depocentre and more lateral compression at the mini-basin flank exerted by the diapir head. This differences are attributed to inconsistencies between restoration and forward modelling assumptions. In restoration boundary conditions and material assumptions are simplified compared to the true conditions that lead to mini-basin formation (i.e. elastic materials, back-strip to a restoration datum). Hence reversal of the true deformational regime observed at present day configuration is not achieved (e.g. horizontal compaction and vertical stretch in the mini-basin flank). This leads to restored isopachs which deviate from the isopachs used to define the benchmark geometry (see the pictures below comparing restored isopachs with the isopachs used to define the benchmark geometry) and because salt is very mobile a small change in the sedimentary load distribution may result in a different response by the salt. From the pictures showing benchmark and restored isopach comparison it can be seen that the isopachs used in the present simulation are less wide and consider slightly larger thickness towards the depocentre for Formation02 and Formation03. This means that the present simulation considers larger loading in the depocentre and less loading towards the mini-basin flank compared to the benchmark which is consistent with the predicted larger sinking and larger horizontal compression in the mini-basin flank.
Comparison of predicted mini-basin geometry to the benchmark geometry
Comparison of isopachs obtained from restoration (used in the present simulation) and isopachs used to define the benchmark geometry
|


